Recent Posts
Collections
- abortion
- accidents
- administrative-divisions
- agriculture
- ai-generated
- airports
- alternate-future
- alternate-history
- americas
- analogies
- ancestry
- anglicised
- animal-sounds
- animals
- anthems
- asia
- autocomplete
- beliefs
- bible
- biomes
- birthplaces
- borders
- borders-within
- buildings
- capitals
- caribbean
- cars
- cartoons
- christmas
- cities
- climate
- climate-change
- coat-of-arms
- cold-war
- colonies
- colonization
- communism
- companies
- comparison
- conflicts
- consumption
- cost-of-living
- costs
- countries
- coups
- crime
- currencies
- death-penalty
- democracy
- diaspora
- divided
- drainiage-basins
- drinking
- driving
- earth-history
- economics
- education
- eez
- elections
- energy
- english-language
- ethnic-groups
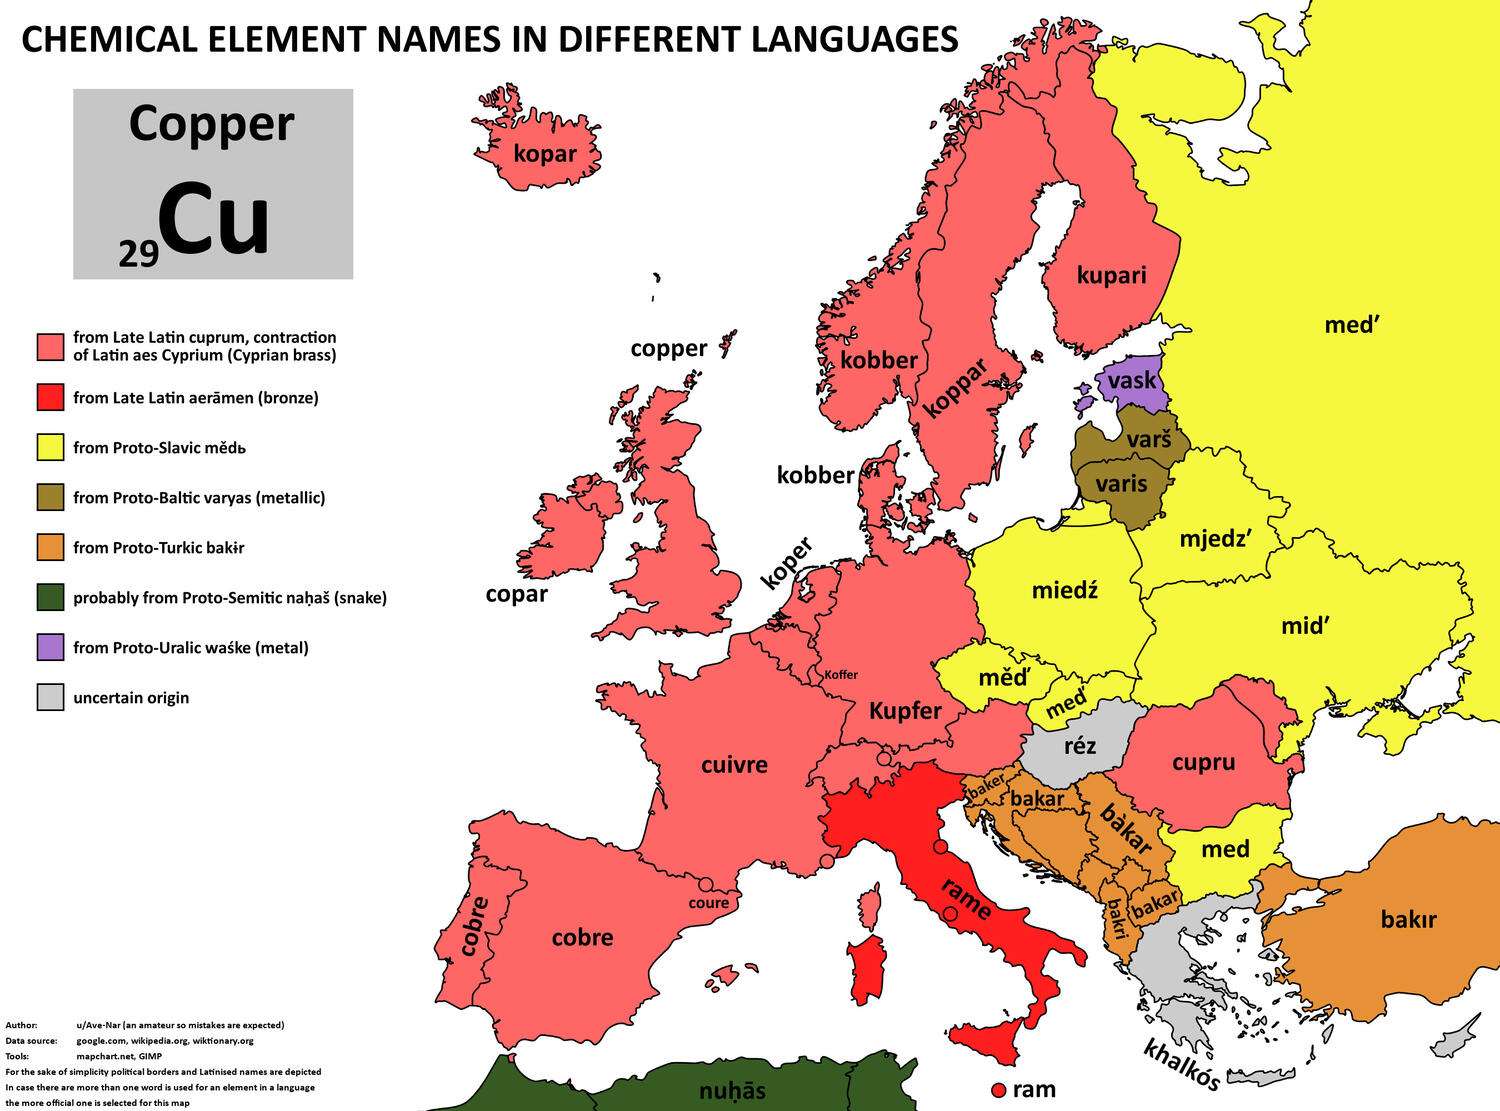
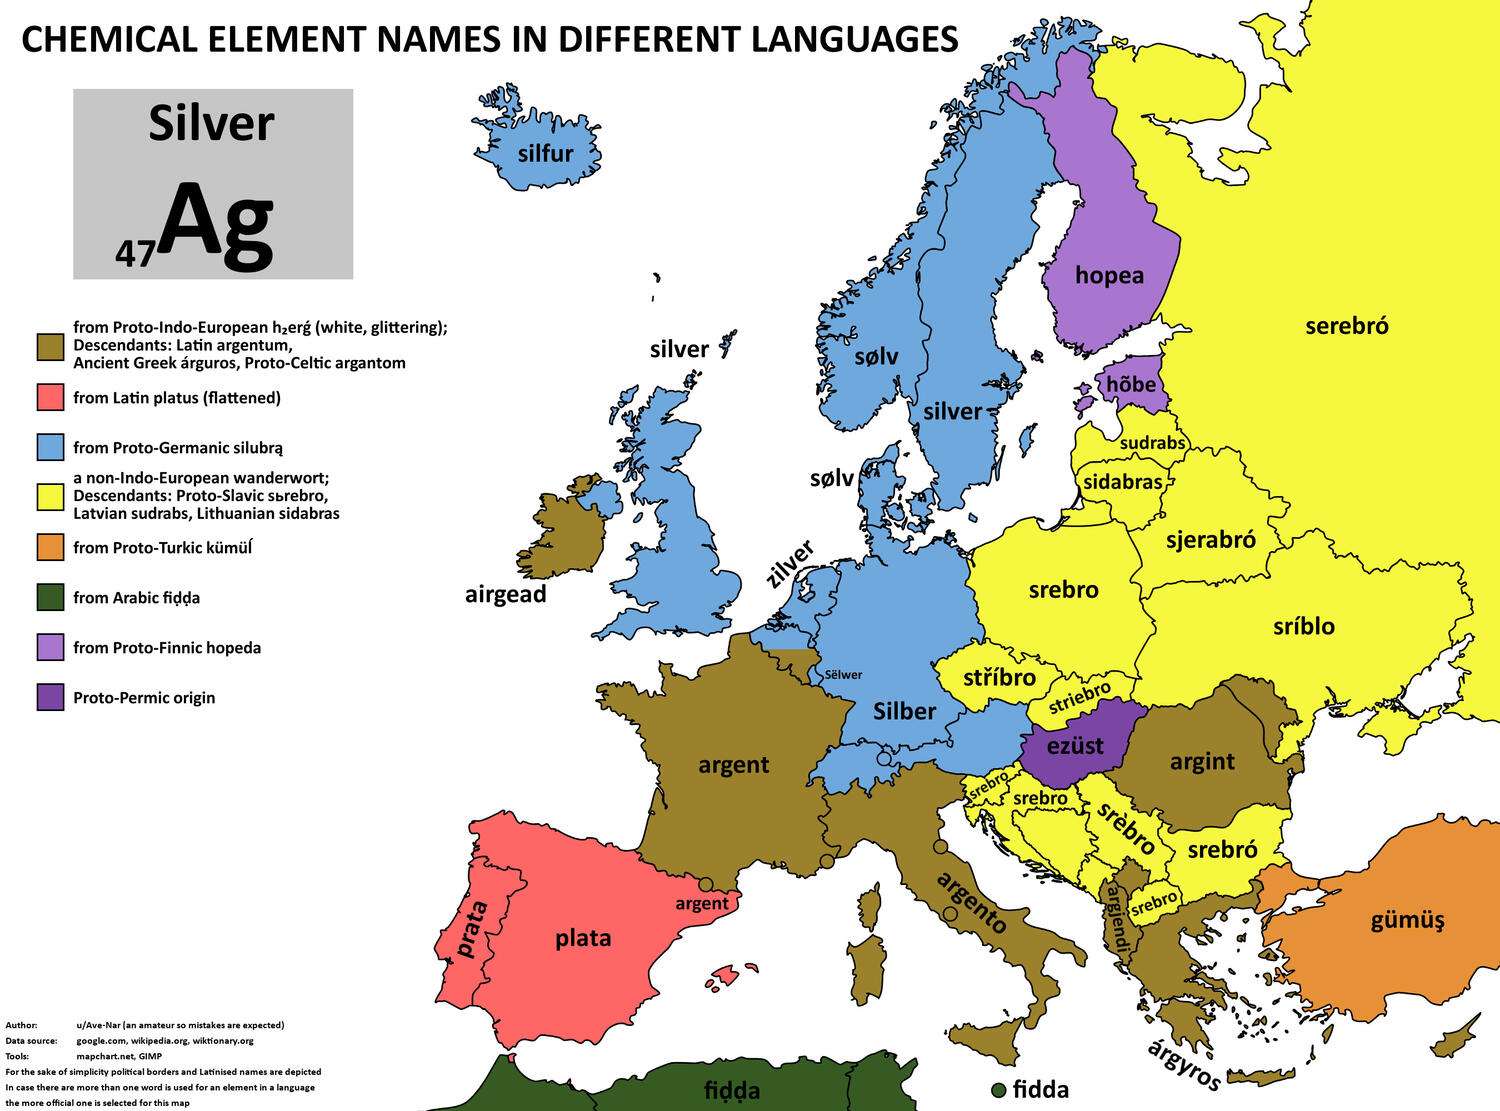
- etymology
- europan-animal-words
- europe
- europe-birds
- europe-fruits-vegetables
- european-animal-words
- european-color-words
- european-country-words
- european-element-words
- european-flags
- european-history
- european-month-words
- european-names
- european-number-words
- european-season-words
- european-words
- euthanasia
- extreme-points
- fertility
- flags
- flights
- folklore
- fonts
- food
- freedom
- gdp
- gdp-per-capita
- gender-inequality
- genetics
- geoengineering
- geological-maps
- geopolitics
- germanized
- government-forms
- grammatical-cases
- grammatical-genders
- hair
- happiness
- hdi
- health
- healthcare
- holidays
- holy-roman-empire
- households
- housing
- human-appearance
- hurricanes
- identities
- imaginary
- immigrants
- indigenous
- industry
- infrastructure
- international-relations
- iq
- isochrone-maps
- italian-words
- land-reclamation
- language
- languages
- law
- laws
- legal-age
- letters
- lgbt
- life-expectancy
- linguistics
- literal-meanings
- marriages
- measurement-systems
- media
- median-age
- memes
- migrants
- migration
- military
- minorities
- monarchies
- mottos
- movies
- music
- names
- national-animals
- national-parks
- nationalities
- natural-resources
- new-year
- nicknames
- nuclear-power
- nuclear-weapons
- old-maps
- organizations
- pets
- phone-codes
- phrases
- placenames
- points-of-interest
- politics
- population
- population-change
- population-density
- population-divided
- ports
- poverty
- precipitation
- prehistory
- prices
- prisons
- production
- productivity
- projections
- pronunciation
- propaganda-maps
- proposals
- public-health
- public-holidays
- rail-network
- recognition
- referendums
- regions
- related-flags
- relief
- religions
- religiosity
- rent
- rich
- rivers
- roads
- roadsigns
- rule-length
- same-latitude
- sea-level-rise
- separatism
- separatist-movements
- shadow-borders
- similar-climate
- similar-gdp
- slavery
- soccer
- space
- speed-limits
- sports
- standards
- stereotypes
- stores
- subways
- surveys
- temperatures
- territorial-changes
- territorial-claims
- territorial-disputes
- territorial-peak
- territorial-waters
- time-zones
- tipping
- topological-maps
- tourism
- trade
- traditions
- transportation
- travel
- travel-advice
- tv
- universities
- us-cities
- us-presidents
- us-states
- vegetation
- video-games
- visa-requirements
- volcanoes
- wages
- watersheds
- weapons
- web
- web-searches
- weekday-words
- what-if
- women
- words
- world
- world-history
- world-maps
- world-war-1
- world-war-2
- writing