
Population change in Eastern Europe since 1991
author: geo.universe/instagram, added on: 2026-01-25
geo.universe:
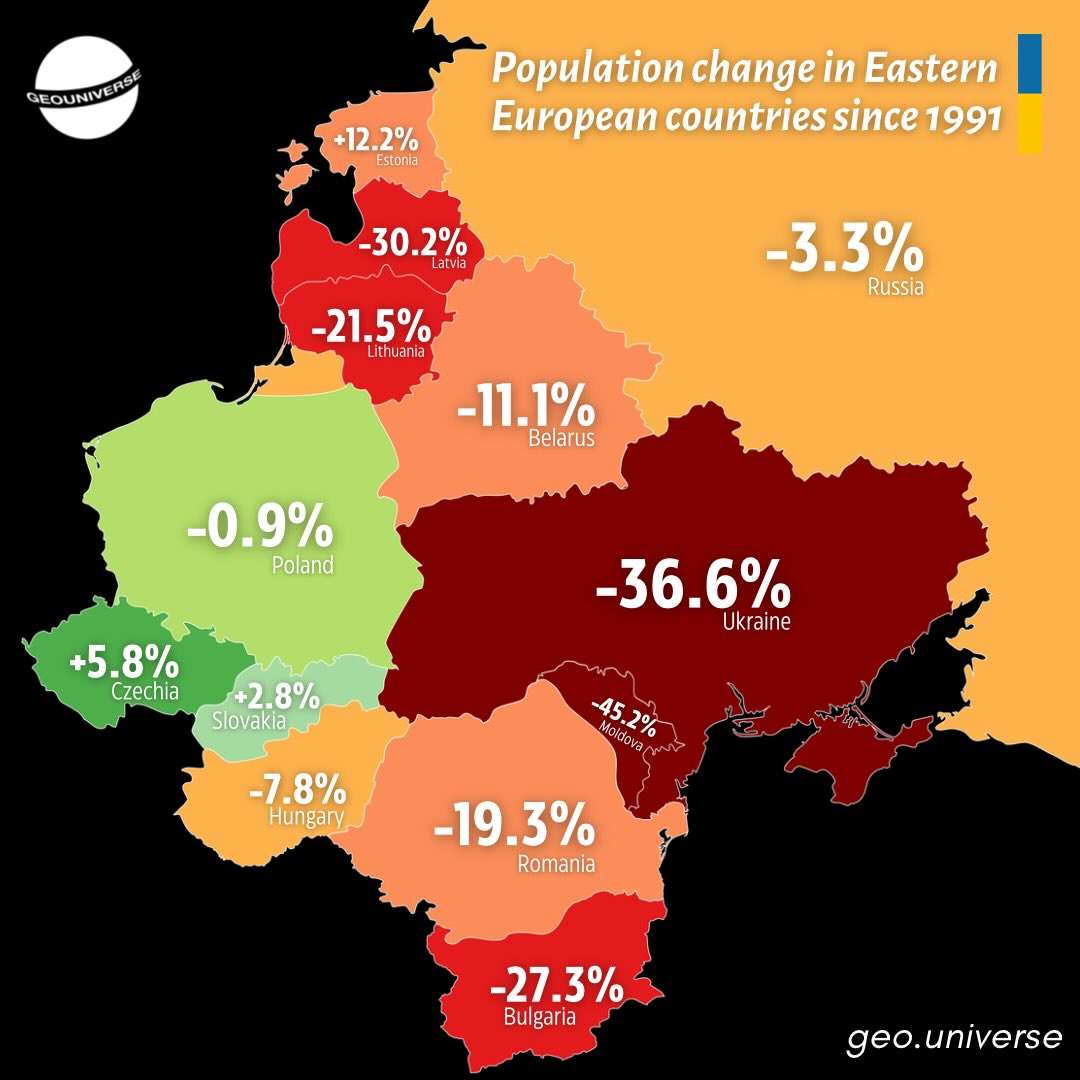
After the collapse of the USSR, Eastern Europe entered one of the biggest demographic shifts in modern history. Using official population data from 1991 vs 2025, here’s what changed (population in millions):
🇷🇺 Russia – 148.5 ➝ 143.6 (-3.3%)
🇺🇦 Ukraine – 51.9 ➝ 32.9 (-36.6%)
🇧🇾 Belarus – 10.2 ➝ 9.1 (-11.1%)
🇲🇩 Moldova – 4.3 ➝ 2.4 (-45.2%)
🇷🇴 Romania – 23.3 ➝ 18.8 (-19.3%)
🇵🇱 Poland – 38.4 ➝ 38.0 (-0.9%)
🇧🇬 Bulgaria – 8.6 ➝ 6.3 (-27.3%)
🇭🇺 Hungary – 10.4 ➝ 9.6 (-7.8%)
🇨🇿 Czechia – 10.3 ➝ 10.9 (+5.8%)
🇸🇰 Slovakia – 5.3 ➝ 5.4 (+2.8%)
🇱🇹 Lithuania – 3.7 ➝ 2.9 (-21.5%)
🇱🇻 Latvia – 2.7 ➝ 1.9 (-30.2%)
🇪🇪 Estonia – 1.6 ➝ 1.4 (-12.2%)
🔍 What’s driving the decline?
Low birth rates, massive emigration, economic transitions, and — in some cases — war.
💡Source: IMF, Eurostat
Collection: population-change - Tags: eastern-europe, population-change - Source: instagram.com