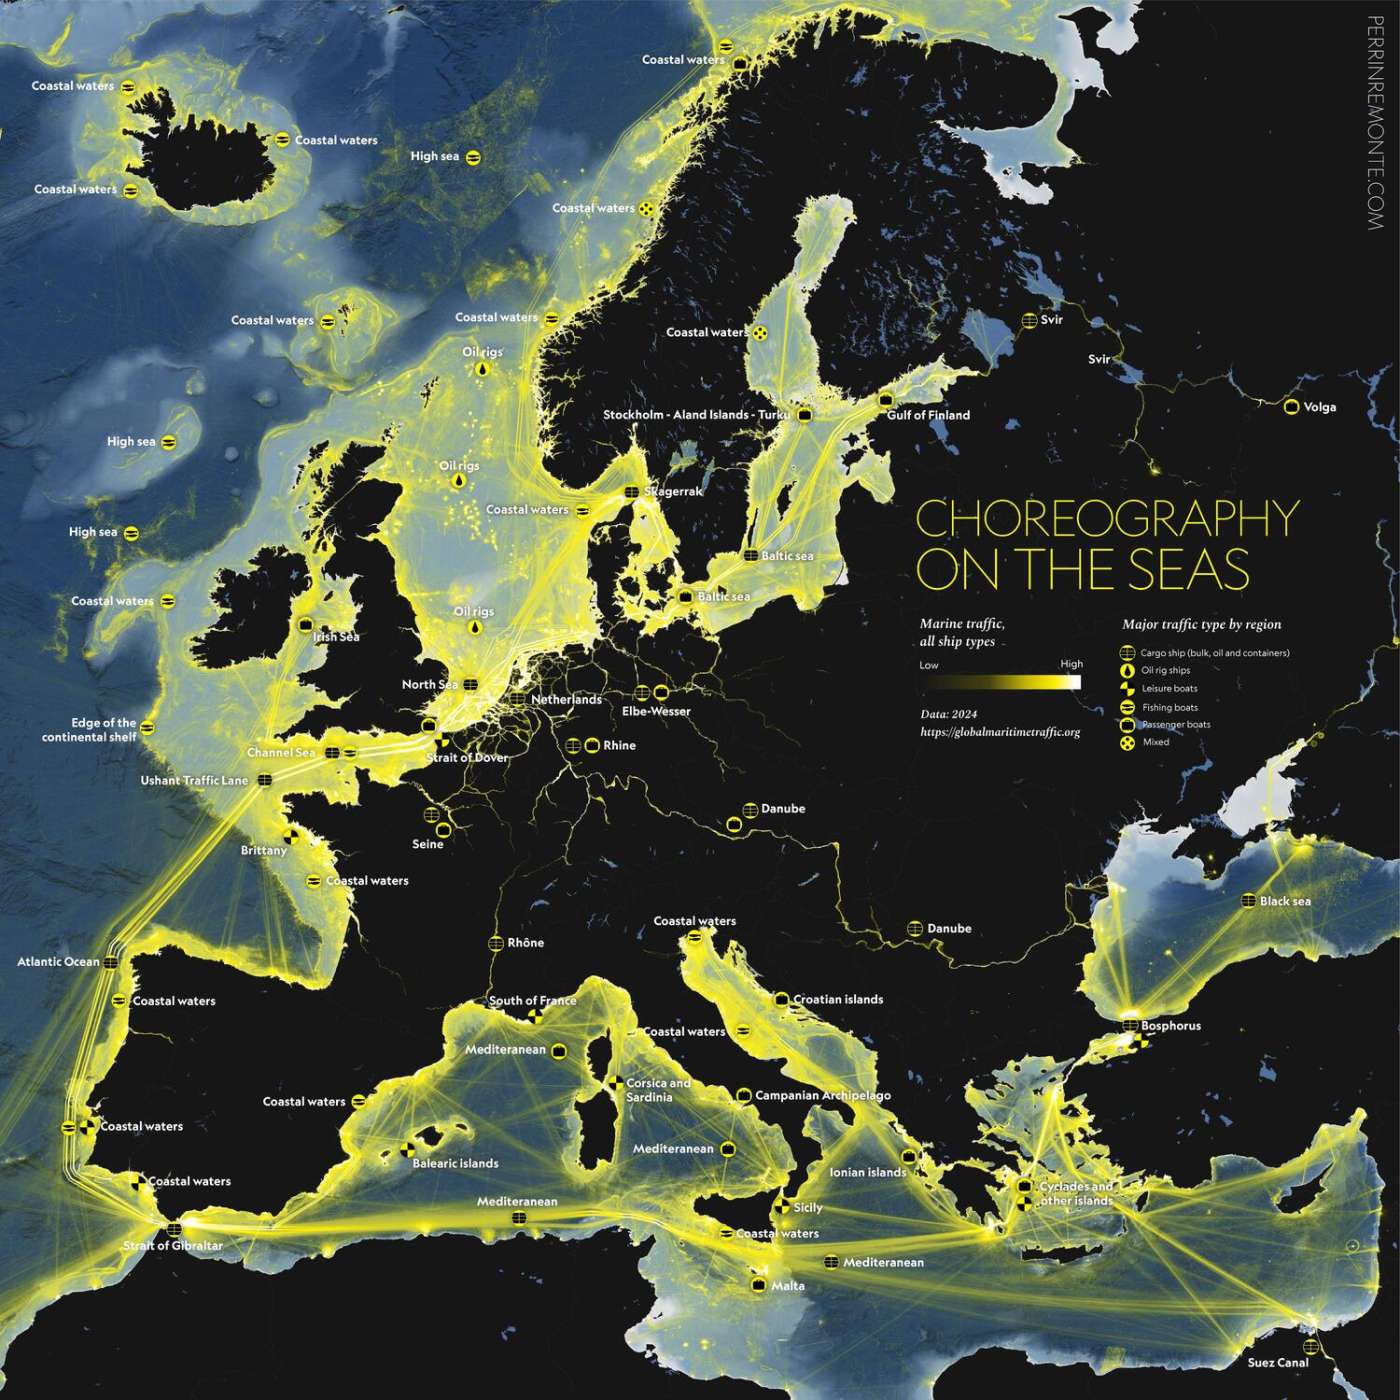
Choreography on the seas – a map of marine traffic in Europe
mydriase:
I had been dreaming of making this map for a while, but I’ll admit that data research is my weak spot and it intimidates me. Still, I think the effort was worth it, especially since the data is actually very easy to access: https://globalmaritimetraffic.org/gmtds.html
Choreography — what a beautiful word. Literally, the drawing, the writing of dance. Which dance? The one performed by the 50,000 to 200,000 ships at sea at any given moment! And the drawing? It’s the map, of course.
🚢 ⚓ 🚢 When you live your life on land and suddenly look out to sea, maybe spotting a sail or two from recreational boats, it’s hard to imagine the incredible bustle of this ballet of ships of all sizes — carrying bulk goods, hydrocarbons, tools, people, or fish — that constantly traverse the seven seas and weave together the threads of our daily lives: energy, materials, consumer goods, fiber optic cables…
So here is a map revealing what can’t be seen from the human vantage point on shore: the grand dance of ships, shown as hours spent per square kilometer throughout the year 2024.
In the negative space, you can see geography dictating the rules: population centers, straits, continental shelves, bays, and tourism all spectacularly channel these fleets from one point to another.
🐟 💧 A detail I particularly like: the concentration of fishing vessels off the coast of Ireland, where the seafloor rises from the abyssal plain, several thousand meters deep, to just a few hundred, bringing prodigious amounts of nutrients up from the depths. Fish and marine life gather in great numbers, which in turn attracts the fishers.
Collection: transportation - Tags: europe, maritime-traffic - Source: reddit.com